
- Video Analytics
Announcing: New Video Analytics Capabilities
At universities around the world, campuswide lecture capture is becoming as ubiquitous as the LMS. In the enterprise, video is becoming the preferred medium for employee onboarding, training, and communication. As a result, the amount of video that these organizations store in their “internal YouTubes” is exploding. In fact, Gartner estimates that the growth of video and other unstructured data is outpacing structured data by a factor of five.
This growth of video content in businesses and academic institutions is placing additional importance on the role of video analytics. Through analytics, content creators and system administrators can get insights into employee and student viewing behavior, video popularity, viewer engagement, system status and more.
In response to this, and through some great feedback we’ve received from our customers, we’re excited to launch some new video analytics capabilities today.
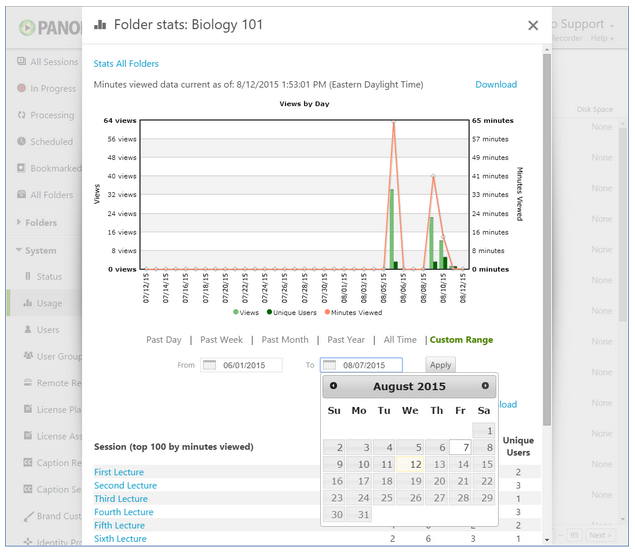
Custom Date Ranges
First, we’ve added a custom date range option to all of our statistics pages. This makes it easy to generate reports that only include data for, say, a given fiscal quarter at your business, or a semester at your university.
To generate a report with a custom date range, simply go to the desired statistics page, click the Custom Range option, specify your dates, and click Apply.
Exportable, Aggregate Reports
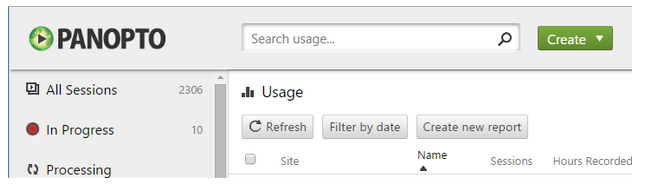
In addition to custom date ranges, we’ve also made it easier to access system-wide data sets that you can then slice and dice with Excel, Tableau or other 3rd-party analytics tools. Specifically, we’ve added a new system for scheduling system-wide reports that can be downloaded as a comma-separated value (CSV) file. These reports can sometimes take a while to compute, so when you schedule your job, we’ll start processing the report in the background. Then, when your report is ready, we’ll email you a link to the CSV file.
To create a new aggregate report, go to your Usage page and click Create new report.
Specify the type of report you’d like to run and the date range for the report. With today’s release, we support the following aggregate report types:
- Aggregate folder usage
- Aggregate session usage
- Aggregate user viewing usage
- Aggregate user creation usage
- User last login time
Then simply click the Create job button. The job will begin processing in the background, so you can close the dialog and work on other things.

Once the job has completed, we’ll send you an email where you can download the CSV file.
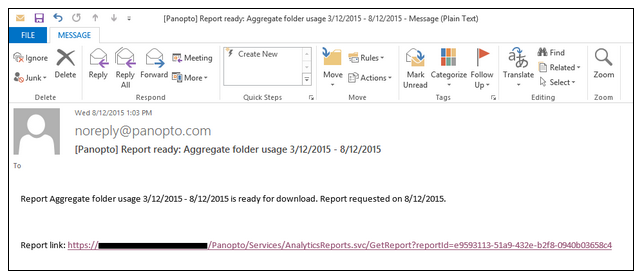
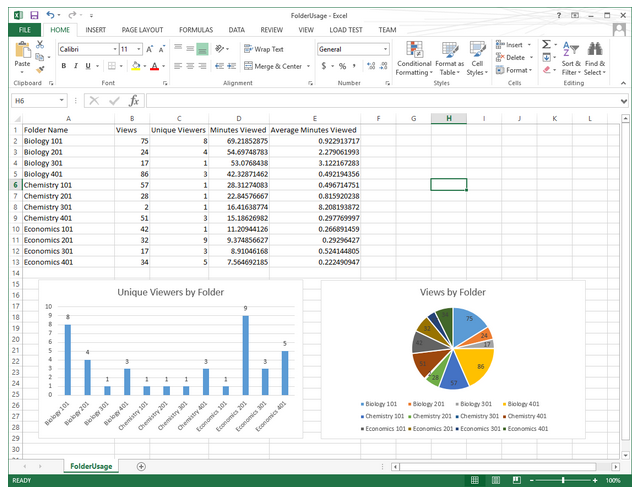
At this point, you can open your file in an analytics tool. Below is an example using Excel.

From there, the sky’s the limit for data analysis, crunching, and charting. Below you’ll see a simple set of charts created in Excel.
Programmatic Access
As with all features in our video platform, developer access through open APIs was a top priority in our new analytics capabilities. Specifically, the new reporting job system includes programmatic support using our REST APIs. So if you’re a developer looking to incorporate video reporting into existing analytics workflows, you can easily schedule and download these reports.
Keep the Feedback Coming!
Our new video analytics capabilities are based on direct feedback from our customers. As always, the more we hear from you, the better we can make our product. So whether you like a feature and think it can be improved, or hate a feature and want it changed, just let us know. Thank you to everyone who helped shape the new analytics functionality, and happy reporting!