


トラッキングと分析
Know what’s working—and what’s not—across your video library
Panopto’s tracking and analytics give instructors, L&D teams, and administrators visibility into how video content is actually being used—who watched, how much, and whether the content is driving the outcomes it was created for.
Analytics that turn viewing data into decisions
From individual viewer completion data to organization-wide content performance, Panopto’s analytics surface the information that matters—without requiring a separate platform or manual reporting effort.
Viewer engagement analytics
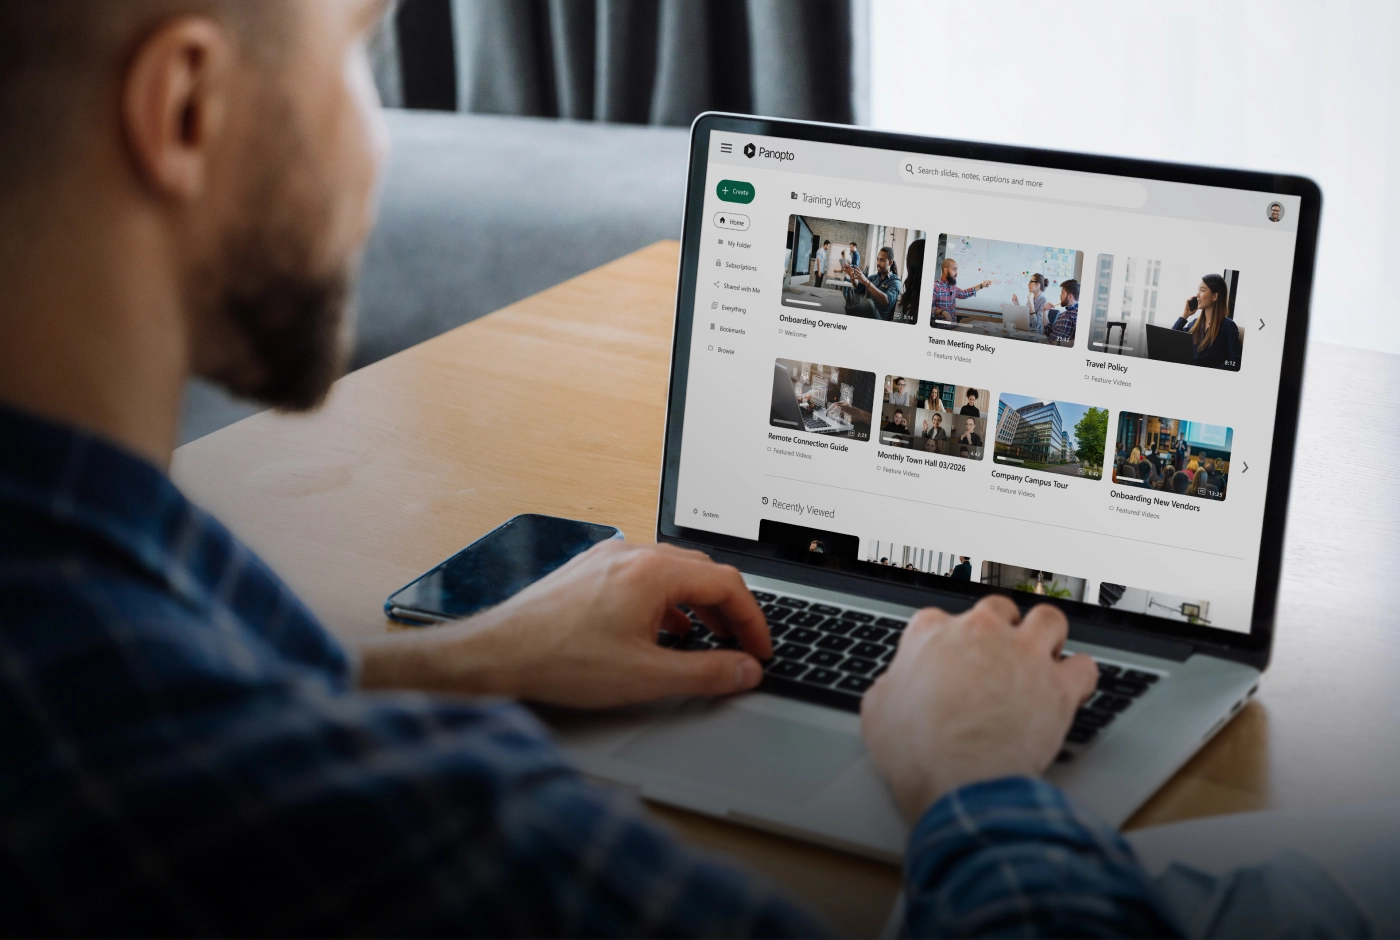
See how each learner is engaging with every video
Panopto tracks how each viewer engages with every recording—including how much they watched, what percentage they completed, and how they accessed the content. Instructors and L&D teams use this data to identify who may need additional support and which content is earning its time investment.
Assessment and comprehension data
Connect viewing data to evidence of understanding
Quiz and knowledge check results from in-video assessments are tracked alongside viewing data—so it’s possible to see not just whether someone watched, but whether they understood. Cohort-level comprehension reporting identifies which concepts need reinforcement, and results feed into many LMS gradebooks where assessment data is already being managed.
Content performance and library analytics
Understand which content is earning its place in your library
Library-level analytics show which videos are being watched, how often, and by whom—giving administrators and L&D leaders the data to make informed decisions about content investment. High-value content can be identified and prioritized; underperforming content can be updated or retired before it creates confusion across the organization.
Compliance and audit reporting
Produce training records that hold up under review
For organizations with compliance training obligations, Panopto tracks who accessed which content and when—with completion and time-on-content data that gives compliance and legal teams a defensible record without manual reconstruction. Reports can be generated and exported quickly when auditors ask.
プラットフォーム用アドオン
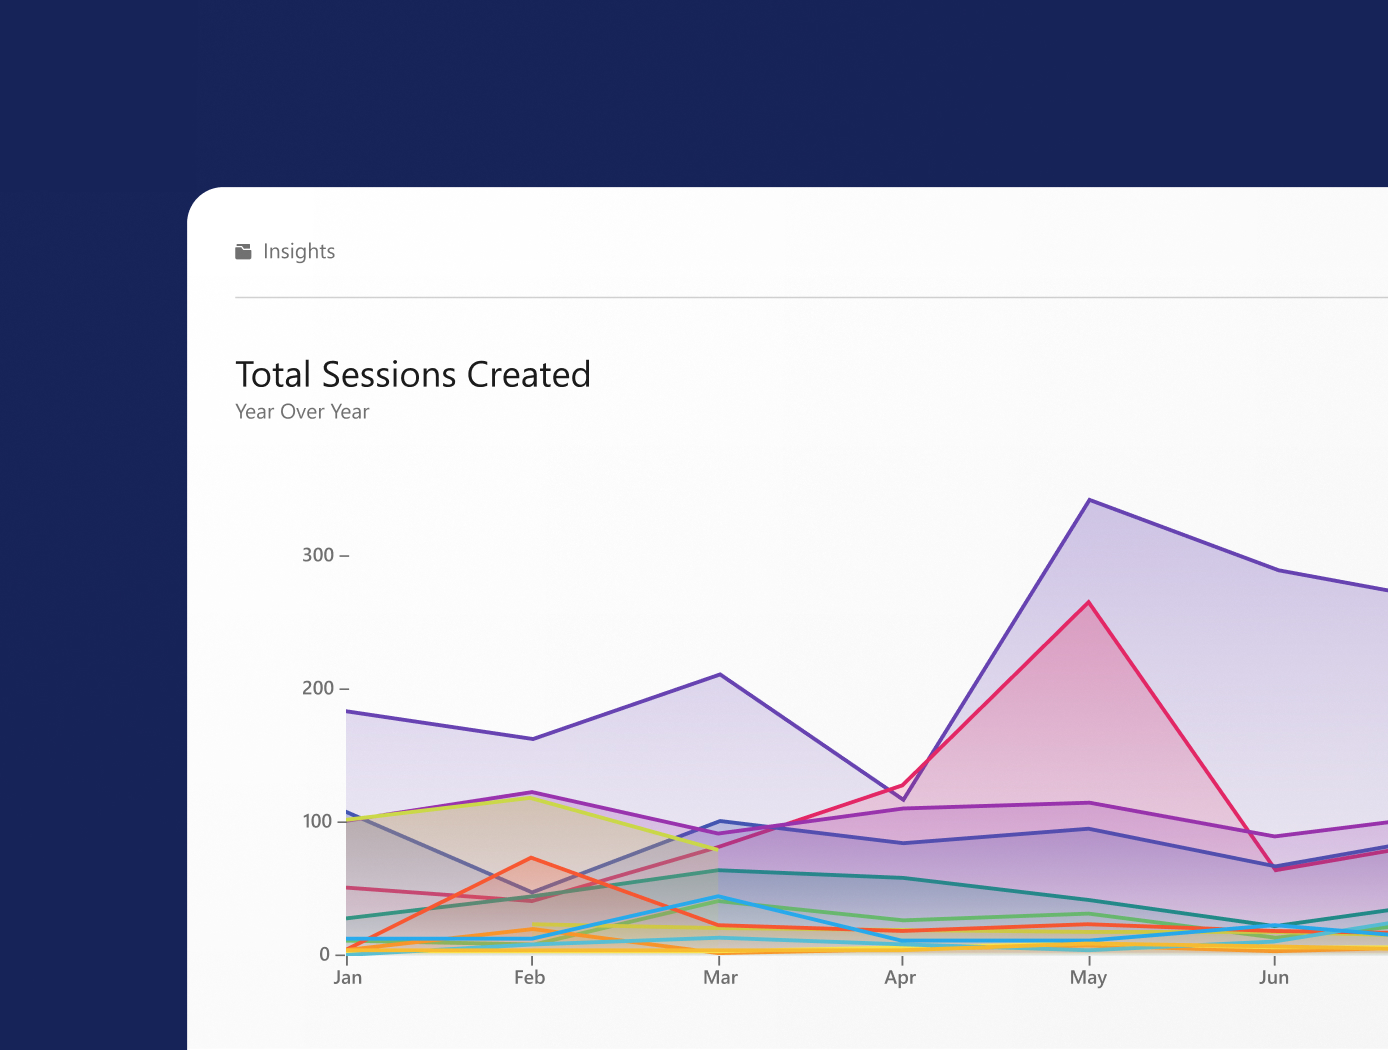
Go deeper on learning trends across your entire organization
Knowledge Insights extends Panopto’s analytics with specialized dashboards that surface usage, retention, and creator insights month-over-month and year-over-year. Custom alerts notify administrators of storage and usage milestones before they become operational issues—giving leadership a proactive view of how the platform is performing across the organization.
Panopto その他の機能をご覧ください
Tracking and analytics are one part of a platform designed to make video work harder across your entire organization. Explore the capabilities that make it possible.
よくある質問
What viewer data does Panopto track?
Panopto tracks per-viewer engagement at the individual level—including how much of a video each person watched, what percentage they completed, how they accessed the content, and trends around where viewers paused, rewound, or dropped off. Data is available at the individual viewer level and aggregated across cohorts, making it useful for both identifying learners who may need support and evaluating content performance at scale.
How can I tell if my training videos are actually working?
Panopto’s analytics combine viewing data with in-video assessment results—so it’s possible to see not just who watched a recording but whether they demonstrated comprehension afterward. Completion rates and quiz scores from in-video assessments can be reviewed at the cohort level, making it practical to identify which content is meeting its learning objectives and which concepts need reinforcement or revision before the next training cycle.
Can Panopto generate compliance training records?
Yes. Panopto tracks who accessed which training content and when, with completion and time-on-content data that produces an auditable activity log. Reports can be filtered by user, folder, course, or date range and exported for compliance reviews and audits. For organizations in regulated industries where training documentation is a regulatory requirement, Panopto’s reporting eliminates the manual reconstruction that’s common when training is delivered across multiple disconnected tools.
What library-level analytics does Panopto provide?
Panopto’s library analytics show which videos are being watched, how often, and by whom—giving administrators and L&D leaders data to make informed decisions about content investment. View counts, unique viewer tracking, and usage trends over time are available at the folder, course, and system level. Content that’s rarely viewed, consistently dropped, or no longer current can be identified and updated or retired based on data rather than intuition.
Does Panopto integrate analytics with my LMS or other reporting tools?
Panopto’s analytics are available natively within the platform and can be integrated with connected LMS platforms where grade passback and completion data are supported. For organizations using Canvas, Blackboard, or D2L Brightspace, quiz scores and completion data flow into the LMS gradebook automatically. The Knowledge Insights add-on extends this with dedicated dashboards for usage, retention, and creator activity—surfacing month-over-month and year-over-year trends in a format suited for reporting to leadership. Read more about our integrations.
How does Panopto’s engagement heatmap work?
Panopto generates per-viewer engagement heatmaps that visualize attention and interaction across the timeline of a recording. These heatmaps show viewing density—making it easy to spot moments in a video that consistently lose the audience or that viewers return to repeatedly. For instructors, this surfaces which parts of a lecture or training module may need clarification. For L&D teams, it informs content revision decisions before the next cohort goes through the same material.
Can I get analytics on who is creating content, not just who’s watching it?
Yes. Panopto tracks creator activity alongside viewer data—including how much content is being produced, by whom, and across which departments or folders. The Knowledge Insights add-on extends this with dashboards that surface creator trends over time, helping administrators understand where content production is concentrated and where investment in creator training or tooling might have the most impact. Read more about Knowledge Insights.