

- Enterprise IT/AV
Need Best-In-Class Live Streaming Analytics? Look No Further Than Panopto + Hive.
You’re preparing to live stream an upcoming event where your CEO will be delivering a key message to employees and partners. Cameras are ready, the stage is set, speech is written and promotional activities are done.
Now all eyes are on you, the production team.
Your job? Ensure the event goes flawlessly, including streaming of high-quality video to remote attendees and locations.
The big question? How do you identify if there are any streaming issues?
Streaming Can Present New Challenges
Live streaming of executive messaging, corporate communications, employee development, and corporate events are quickly becoming the new way organizations keep remote offices, campuses, employees and students up-to-date. But live streaming can often create new headaches for IT and new challenges for video production teams. The need to ensure high-quality video can be streamed successfully to all areas of the business, including remote locations, is imperative.
To address this, many teams are now tracking new network-centric KPIs like quality of service (QoS), quality of experience (QoE) and network load to better identify how the network is performing and if there are any bottlenecks. This is especially true, and often most needed during the streaming of live events, which given its own nature can commonly test the network by creating unique and often high demand usage patterns as users tune into the live stream from a variety of locations, devices, and browsers.
Because network bottlenecks and streaming issues often only appear during the streaming of live events, IT and video production teams need an easy and straightforward way to monitor and troubleshoot network performance during these live events.
With Panopto and Hive Streaming they now can.
Live Stream With More Confidence
With Panopto and Hive, IT and video production teams can now more confidently stream live videos and events by being able to track performance and quality of the event.
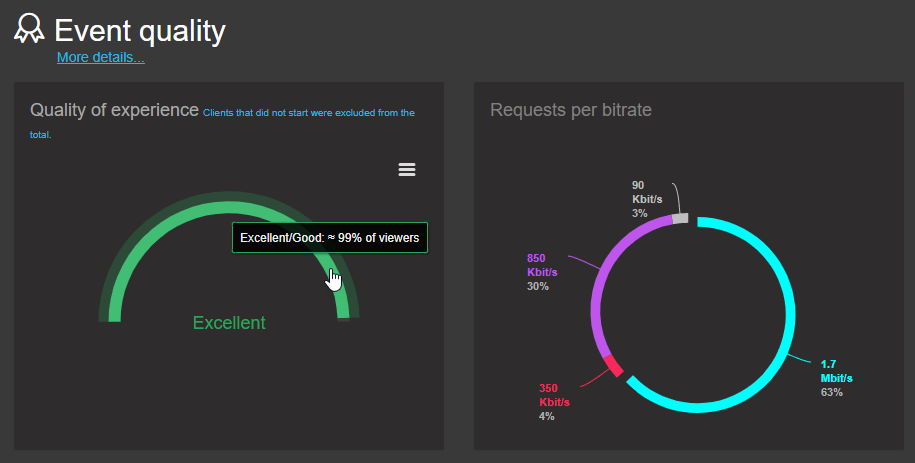 Event quality view that shows an interactive view into the overall quality of experience for viewers attending the event
By teaming up with Hive Streaming, a leader in enterprise video distribution, Panopto customers will have free access to Hive Insights, a video analytics dashboard that provides interactive insights on live event performance, quality of experience, and network load. With Hive Insights, IT and video production teams can now use an intuitive interactive dashboard to easily monitor, analyze and filter aggregate viewing data on Panopto live streams to identify where network stream issues may be occurring because of network bottlenecks or high data usage.
Easily Get QoS And QoE Answers
With Hive Insights, Panopto customers can quickly and easily find answers to a vast array of live streaming quality of service and network load questions. These include aggregate live event performance, regional performance, device, browser, and user performance. With just a few clicks of a button, data can be easily viewed and filtered to quickly answer questions.
Data and event details include a variety of detailed information on the event while it’s in progress, including views on:
Viewers:
- Aggregate Viewer Data
- Number of live viewers by time
- On-demand viewers by day
- Viewing duration ranges (number of people watching for 0-3 minutes, 4-10 minutes)
- Average viewing duration for live viewers
- Average viewing duration for on-demand viewers
- Overall Quality of Experience (Excellent, Good, Fair, Poor, Very Poor)

Geography and region:
- Viewers by geography (map view)
- Locations with the most viewers
- Locations with quality issues
- Location (Country, state, city, subnet)
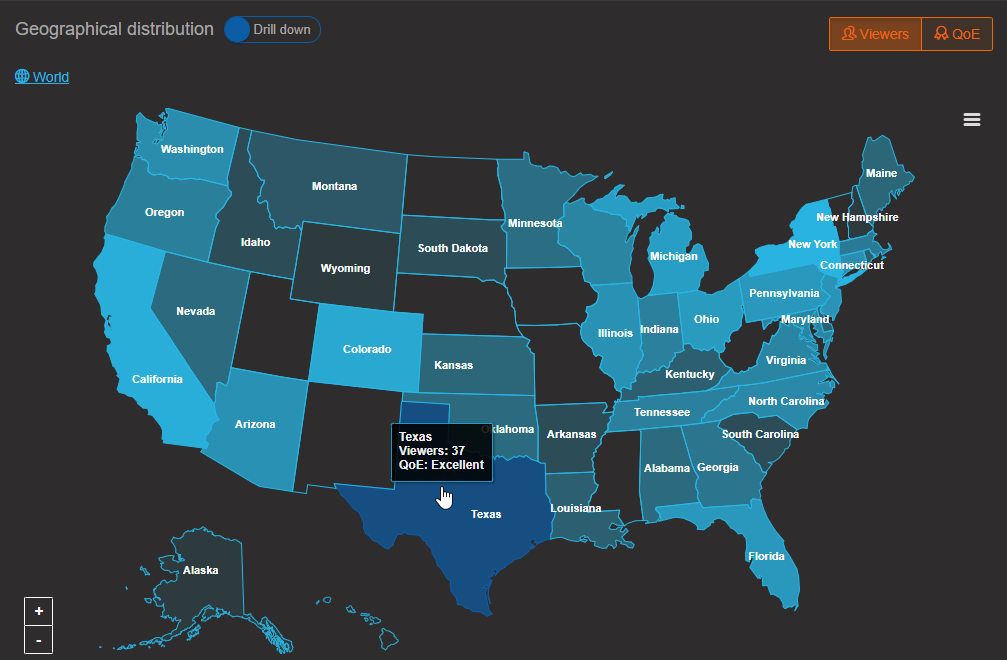
Quality of experience:
- Geography (map view)
- Aggregate
- Summary

Hive Insights includes additional details on items such as:
Devices and browsers:
- Devices used
- Operating systems used
- Browsers used
Time:
- Startup time
- Source requests by time
- Source load by time
Bitrates and streaming:
- Requests per bitrate summary
- Requests per bitrate by time
- Buffering severity by time
And views and aggregate data can also be filtered by:
- Location (Country, state, city, subnet)
- Quality of experience (Excellent, Good, Fair, Poor, Very Poor)
- OS, browser, device type
Individual viewer data can be filtered by:
- Quality of experience
- Location
- Public IP or Private IP (when available)
- OS, browser, device type
- Source errors
- View duration
- Started watching at (time)
- Startup time (seconds)
- Buffering by time (seconds)
- Content bitrate by time (Mbit/s)
- Player buffer size by time (seconds)
- Source throughput by time (Mbit/s)
- Client download by time (Kbit/s)
- Source errors
- Player events (Buffering, Playing, Pause, Skip, Page in Foreground/Background)
Try Live Streaming Your Next Event With Panopto
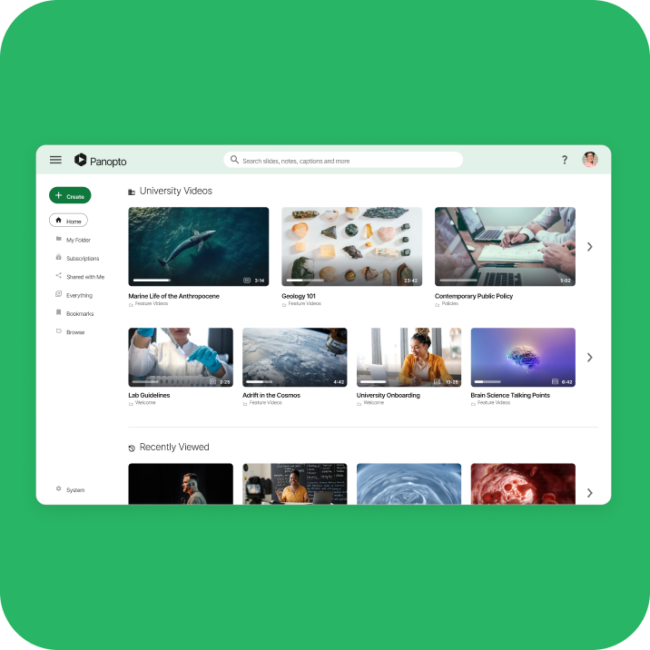
Panopto is an industry-leading video platform used by businesses and universities worldwide to live stream, record, and host videos. Unlike other video solutions, Panopto gives you complete control over who can access and see your video content, so videos that are private remain truly private, and public-facing content is easy to play without downloading extra software or apps. Contact our team to request a free trial today.