
- Uncategorized
This Week In Ideas Shared With A Panopto Video — August 22, 2014
Visualization has become a regular part of how we do business today.
Business analysts visualize data to better illustrate trends. Program managers visualize processes to better display how processes really work. And marketers visualize consumer sentiments and the competitive landscape, helping to show where new business opportunities may lie.
Some 55 percent of communication is purely visual. So it’s no surprise that organizations have drifted away from sharing ideas in black and white text to the more visually engaging slide deck format. And when you consider that an additional 40% of communication is vocal, it’s easy to see why more and more businesses are adopting video as a means to fully present those decks — and help their team members visualize new ideas.
Recorded presentations give professionals in businesses and academic institutions a powerful mix of communication opportunities — written text supplemented with visual design and supported with actual dialog.
Ever more organizations are seeing the power of visualizing ideas with video-enabled communications. And the proof is in the tape — this week we saw more educational and entertaining recordings among the latest presentations shared online with the Panopto video platform.
And in the spirit of passing it on, these are just a few of the ideas shared this week with Panopto’s presentation recording software.

Visualization of Health Informatics Data
Join the Renaissance Computing Institute’s Senior Visualization Researcher David Borland for his recorded presentation on how the healthcare industry can visualize data. Borland shares details on the fundamental divide between scientific versus informational visualization, and gets into the details on state-of-the-art data analysis strategies that can be used to help visualize the often-quantitative field of health informatics.
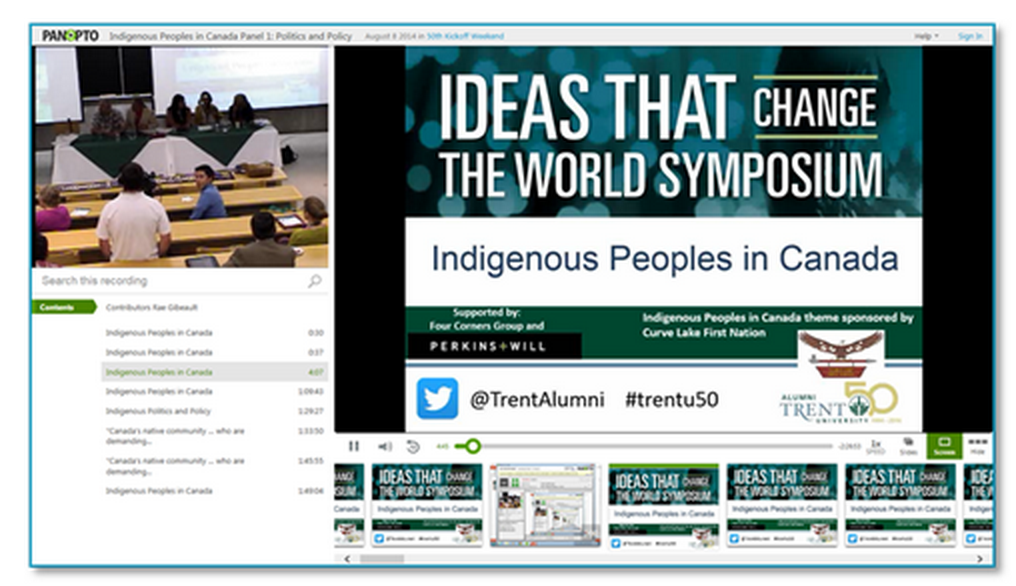
Indigenous Peoples in Canada
Join Trent University for the Ideas That Change The World Symposium, held in honor of the university’s 50th anniversary. In this recording of the symposium keynote panel, presenters provide frank appraisals and critiques of where we have been and where we need to go to address critical issues facing Canada’s Indigenous Peoples and the entire Canadian society.

Visualizing Art Trade Flows For a 17th Century Antwerp Dealer
Sit in with the Duke University Art Law and Markets Initiative and learn first hand about the transatlantic art trade in 1600s, as part of this recorded lecture. In this incredibly rich and detailed presentation, you’ll see how the market for art at this time adapted and evolved with the introduction of works from Central and South America, and what that market evolution meant for trade, exports, and shipping.

Reverse Engineering the Brain One Synapse at a Time
Understanding the workings of the human brain is perhaps the greatest challenge for several academic fields, from medicine to psychology to anthropology to biology and more. So today, join Joshua Vogelstein of the Duke Mathematics and Statistical Science department in this recorded lecture on how academics are discovering ever more about how the brain functions, and how new data visualization tools are assisting in the exploration.

Visualizing Tweet Sentiment
The open public forum that is Twitter has been mined in recent years to offer insights on everything from election projections to viral infection patterns. A researchers are able to take an increasingly sophisticated look into the content of the Twitter stream, tweet sentiment has become a target for many as a means to better illustrate just what is being said. Find out the very latest in how researchers are visualizing tweet sentiment in this recorded lecture from North Carolina State University’s Christer Healey, including how his team is visualizing the commentary on twitter across a matrix of four factors to create a more useful understanding of what’s really being said.
Try It For Yourself!
Panopto makes it easy for anyone, anywhere to visualize their ideas with a recorded presentation and share them online, both as live streaming webcasts and recorded on-demand video. To see how Panopto can help you share your ideas, contact our team for a free trial today.